Why VC curves are probably the most important criteria to compare the performance of vibration isolators
Typically, different vibration isolators are compared using the transmissibility curve and resonance frequency as measures. Both these specifications are extremeny important for any isolator, since they basically define how much vibration reduction the isolator is capable of, depending on the frequency of disturbance. As most vibration isolators can be modelled in a first approximation as a mass suspended on a spring and damper, the transmissibility has the following characteristics, and isolation starts above 1.41 times the resonance frequency.
Clearly, the resonance frequency should be as low as possible, since it would shift the whole curve to the left, realizing isolation in a broader frequency range, and also to a stronger amount.
However, especially in active vibration isolators, one cannot neglect certain nonlinearities and further sources of excitation. Namely this is the maximum allowable force from the actuators, which limits the performance towards large amplitudes.
Equally important is the performance under low excitation sources. It is a fact that all electronic components in an active systems generate some self-noise. Even piezoelectric sensors include to a certain amount noise in the sensor signal. The sensor signal is amplified multiple times in the feedback loop to generate the strong vibration isolation performance. As the control cannot distinguish between the noise and the real signal, also the noise reaches the actuators and excites the isolated platform with a certain noisy vibration spectrum. This noise is independend from the vibration excitation, and represents a constant vibration spectrum on the isolated plate. It is the lower limit of the absolute amplitudes, which the isolator is capable of.
It is therefore a hard fact to compare different isolators.
Vibration Criteria curves (VC-curves) are a common industry standard to classify existing vibration levels. They are based on a set of one-third octave band absolute velocity spectra:
Workshop: Distinctly perceptible vibrations
Office: Perceptible vibration
Residential Day: Barely perceptible vibration. Appropriate to sleep areas in most instances Adequate for semiconductor probe test equipment and microscopes less than 40x
Op. Theatre: Vibration not perceptible. Suitable in most instances for microscopes to 100x
VC-A: Adequate in most instances for optical microscopes to 400x
VC-B: Adequate for inspection and lithography to 3 µm line widths
VC-C: Appropriate for optical microscopes to 1000x, inspection and lithography inspection equipment
VC-D: Suitable even for the most demanding equipment including eletron microscopes
VC-E: Assumed to be adequate for the most demanding of sensitive systems including long path, laser-based, small target systems, E-Beam lithography systems working at nanometer scales
Between each VC-curve, limit for the maximum allowed vibration amplitudes is halved.
As VC-E is currently the toughest criterion, all further levels F, G etc. are for evaluation purpose only, and not used in industry standards.
To figure out the limitations concerning the noise floor of the Seismion Reactio, we have tested it on a place with as little vibration excitation as possible, and then measure the spectrum on the isolated top-plate. Following is the test result.
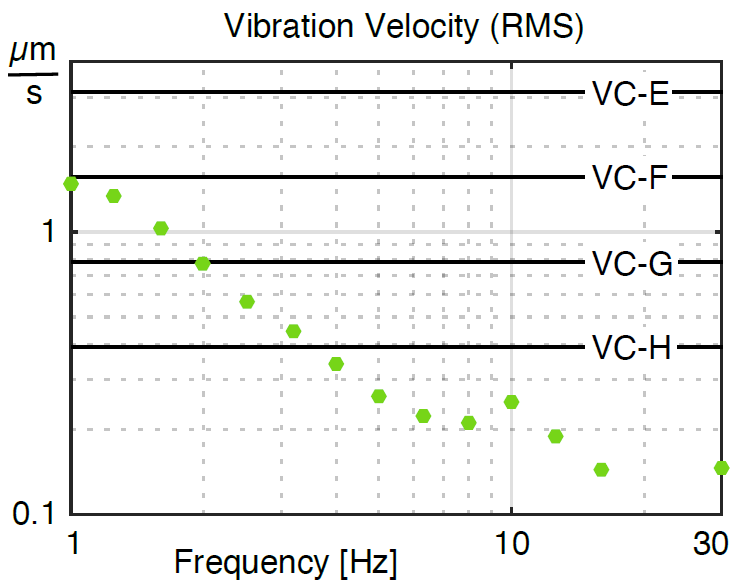
It can be seen that our Reactio achieves VC-F level in the whole frequency range starting below 1 Hz. That means it easily fulfills all industry standards even for the most sensitive systems. Above 2 Hz even VC-G level is realized.
How Seismion realizes industry leading noise floor levels
One key specification in the development of Seismion Reactio isolators has been to realize the lowest noise level amoung all currently available active vibration isolators in its class. The control feedback loop purely consists of analog components, which are selected also based on their noise characterists. The noise level of our piezoelectric sensors are calculated based on scientific publications, and its properties are chosen accordingly.
Often, the transmissibility curves given in datasheets are measured under controlled shaker excitation, which is so large that noise does not have any influence. However, transmissibility curves given by Seismion are all measured only under ambient excitation in laboratory, which should very much agree to the vibration level that the isolator normally experiences under operation.